Use Python (Pandas, Plotly, Matplotlib, Seaborn etc.)
%pip install plotly
import plotly.express as px
import pandas as pd
# Sample data for the dashboard
data = {
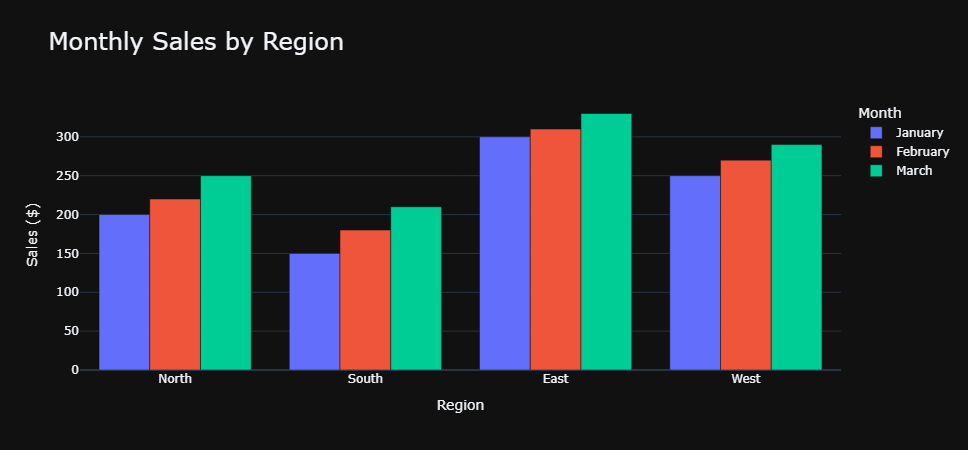
“Region”: [“North”, “South”, “East”, “West”] * 3,
“Month”: [“January”] * 4 + [“February”] * 4 + [“March”] * 4,
“Sales”: [200, 150, 300, 250, 220, 180, 310, 270, 250, 210, 330, 290],
“Profit”: [50, 30, 70, 60, 55, 35, 75, 65, 60, 40, 80, 70],
“Orders”: [20, 18, 30, 25, 22, 20, 32, 28, 26, 23, 34, 31]
}
df = pd.DataFrame(data)
# Create an interactive dashboard using Plotly Express
fig = px.bar(
df,
x=”Region”,
y=”Sales”,
color=”Month”,
barmode=”group”,
title=”Monthly Sales by Region”,
labels={“Sales”: “Sales ($)”, “Region”: “Region”},
hover_data=[“Profit”, “Orders”]
)
fig.update_layout(
title_font_size=24,
xaxis_title=”Region”,
yaxis_title=”Sales ($)”,
legend_title=”Month”,
template=”plotly_dark”
)
fig.show()